
Abstract
Evidence on how blockchain affects firm performance is thin, especially in developing economies such as Bangladesh. Drawing on the Resource-Based View (RBV), this study examines whether blockchain technology adoption (BTA) is associated with financial performance (FIP) and market performance (MAP), and whether blockchain application in accounting information (BAAI) changes these relationships. We surveyed employees of blockchain-adopting firms through non-probability convenience sampling, in person and online, and obtained 121 usable responses (57.6% response rate). The data were analyzed with PLS-SEM in SmartPLS 4. BTA is strongly related to FIP (β = 0.564, p < 0.001) and moderately related to MAP (β = 0.431, p < 0.001). BAAI has no direct effect on either outcome. Contrary to the hypotheses, the BAAI × BTA interaction is negative for FIP (β = −0.167) and MAP (β = −0.142); these effects are small and statistically fragile, and BTA stays positive at every level of BAAI. The findings are associations from a small, cross-sectional, self-reported sample.
Keywords
Introduction
Blockchain is a distributed, decentralized database that records transactions in sequence, creating records that are very hard to alter (Bag et al., 2023; Gurtu & Johny, 2019). Introduced with Bitcoin (Nakamoto, 2008), it now reaches accounting, finance, supply chains, voting, insurance, healthcare and public services (Akter et al., 2024; Beck et al., 2017; Centobelli et al., 2022; Chowdhury et al., 2023; Hughes et al., 2019; Monrat et al., 2019), mainly for accountability, traceability, credibility and integrity (Chittipaka et al., 2023). Traditional accounting is costly, slow and weak at preventing fraud, so clearer accounting information can reduce fraud risk (Cai, 2021).
Some accounting scholars see blockchain as a strong alternative to existing accounting and auditing systems, because it can make accounting information more reliable and timely (Schmitz & Leoni, 2019) and auditable (Aslam et al., 2024) and may cut accountants' workload and costs (Giang & Tam, 2023). The focus is shifting from exploring the technology to building practical applications (Pawczuk et al., 2018), such as smart-contract documentation at the Port of Antwerp (T-Mining, 2024), traceability at United Parcel Service (Chang et al., 2020) and quality assurance in Chinese agro-food supply chains (Tian, 2018).
Large firms in developed countries have started to use blockchain in accounting. Bangladesh still struggles with technology adoption: firms report limited technical expertise, slow internet, weak incentives, trade restrictions and uncertain regulation (Mahmud & Uddin, 2023), so blockchain adoption is at an early stage.
To our knowledge, few studies examine how blockchain technology adoption (BTA) affects firms' financial performance (FIP) and market performance (MAP), or whether blockchain application in accounting information (BAAI) moderates that effect, and earlier work is industry-specific. Our cross-sector evidence matters for developing countries like Bangladesh, and it can help managers, accountants and policymakers judge the performance implications of building blockchain into accounting systems.
This study investigates the relationship between BTA and FIP and between BTA and MAP, and tests the moderating effect of BAAI, through two research questions (RQs). BTA is the extent to which a firm has adopted and uses blockchain in its operations. FIP and MAP are the firm's financial performance (for example sales growth, profitability and customer retention) and market performance (entering new markets, launching new products and their success), as perceived by respondents. BAAI is the extent to which blockchain is applied to generate, record and assure accounting information.
RQ 1. What impact does BTA have on FIP and MAP?
RQ 2. Does BAAI moderate (change the strength of) the effect of BTA on FIP and on MAP?
Literature review
Blockchain Technology
Firms that fail to respond to a changing business environment risk becoming obsolete (Bag et al., 2023; Telukdarie et al., 2018). Blockchain is a ledger that records transactions transparently and irreversibly (Giang & Tam, 2023; Iansiti & Lakhani, 2017), and its main features are transparency, decentralization, immutability and automatic verification (Cai, 2021; Giang & Tam, 2023; Wang et al., 2019). Its peer-to-peer (P2P) structure removes intermediaries, smart contracts run transactions automatically when set conditions are met (Schuetz & Venkatesh, 2020), and cryptography keeps the chain valid (Schmitz & Leoni, 2019). Firms adopt it for these benefits, above all operational efficiency.
Theoretical support
Staying competitive requires technological development (Barney, 2001), but adoption depends on the performance gains firms expect (Maroufkhani et al., 2020). The Resource-Based View (RBV) holds that firms sustain performance advantages through resources that are valuable, rare, inimitable and non-substitutable (VRIN; Barney, 1991). We treat blockchain as a strategic asset once integrated into a firm's accounting system: valuable because it improves the transparency, accuracy and auditability of financial data, rare because few firms in developing economies have adopted it, inimitable because of its technical sophistication and cryptographic security, and non-substitutable because of its decentralized design. These VRIN attributes are theoretical arguments, not tested propositions. Because widely available technology seldom gives an advantage alone, its value depends on complementary organizational resources (Mata et al., 1995), which is the logic behind the moderating role of BAAI proposed below.
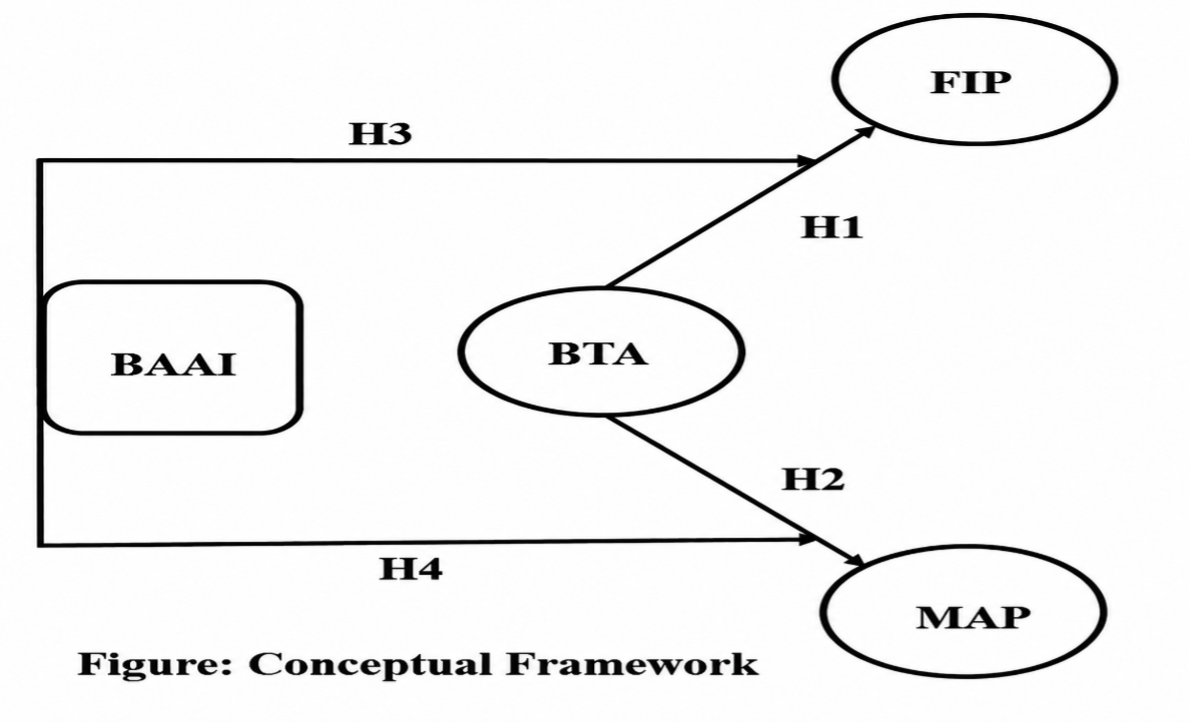
Adoption builds capabilities such as automated recordkeeping, fewer transaction errors, lower verification costs, better audit trails and faster reporting, which should lift performance by cutting costs and improving control, transparency and stakeholder confidence. Adoption alone, however, is only a technological foundation. What matters is how well the accounting system uses the information blockchain generates, so BAAI is expected to moderate the relationship (Figure 1): the effect of BTA on FIP and MAP should be stronger when BAAI is high and weaker when it is low.
The complementarity argument has a rival. Research on technology overload suggests that adding technology-enabled work can burden users and lower productivity once the load exceeds what they can absorb (Karr-Wisniewski & Lu, 2010), and accounting studies point to integration, training and staffing adjustments when blockchain is embedded in accounting (Karajovic et al., 2019; Akter et al., 2024). Deep use of blockchain in accounting could therefore dampen, rather than amplify, the returns from adoption. We keep directional hypotheses grounded in the RBV, the main theoretical account of complementary resources, and treat the overload argument as a rival explanation to which Section 5.1 returns when the results are interpreted. Figure 1 shows the conceptual framework of the study.
Hypothesis development
BTA and FIP
Information is a key business asset that must be protected to keep a firm stable and performing (Abu Afifa et al., 2025; Shameli-Sendi et al., 2016). Weak information security raises financial risk, whereas firms with confidential and intact information achieve better FIP (Abu Afifa et al., 2025; Srinidhi et al., 2015). Blockchain can help reduce that risk.
In current accounting systems, transactions sit in separate ledgers under a central body, so records must be reconciled constantly because of timing differences, disputes and errors (Akter et al., 2024). Blockchain removes this need and reduces disputes by sharing the ledger (Han et al., 2023). It also lowers the chance of fraud and error (Bag et al., 2023; Treiblmaier, 2018), helps retain customers (Karamchandani et al., 2021), smooths administration (Ali et al., 2023) and, being real-time and low-cost, helps adopters earn higher profits (Ko et al., 2018).
Almadadha (2025) found that blockchain adoption improves the financial performance of major Australian banks, measured by return on assets (ROA) and return on equity (ROE), and Li (2025) likewise found that it raises ROA.
In sum, blockchain features such as automation and decentralized control are expected to improve FIP, in line with the favorable association found for emerging technologies generally (Mishra et al., 2022). We therefore hypothesize the following:
H1. BTA has a positive effect on a firm’s FIP.
BTA and MAP
Blockchain brings long-term benefits by strengthening strategic operations and adaptation to a changing environment (Tseng et al., 2023) and gives firms an edge over competitors (Karamchandani et al., 2021). Better decisions and performance depend on better data and transparency (Bag et al., 2023; Wood et al., 2017).
Adoption also digitalizes operations, cuts costs and improves customer satisfaction and logistics performance (Long et al., 2023). Together these help a firm reach a competitive position and win customer loyalty, so blockchain can help it create and retain customers and ultimately improve MAP (Bag et al., 2023). We therefore hypothesize the following:
H2. BTA has a positive effect on a firm’s MAP.
Moderating role of BAAI
Accounting is part of every business (Seshadrinathan & Chandra, 2025), yet its digitalization is still early (Nikzad Amiri, 2014; Vaidyanathan, 2017). Paper-based systems suffer from duplicate entries, delayed recording and complex reconciliations (Cai, 2021; Seshadrinathan & Chandra, 2025), and blockchain's characteristics touch many accounting activities (Akter et al., 2024; Dai & Vasarhelyi, 2017; Pimentel & Boulianne, 2020). By removing intermediaries it can replace existing reconciliation techniques, lower payment costs and help settle disputes (Faccia et al., 2022; Giang & Tam, 2023), and its transparency makes fraud harder to conceal (Cai, 2021).
Blockchain reduces human error and fraud and supports real-time reporting, continuous auditing and greater trust in accounting information (Akter et al., 2024; Dai & Vasarhelyi, 2017; Karajovic et al., 2019). Real-time ledger access, consensus-based validation and irreversible records build trust and accountability in accounting data (Han et al., 2023; Swan, 2015; Deloitte, 2016).
Real-time accounting on a blockchain makes it harder to distort reported earnings and lets observers quickly spot improper asset transfers and conflicts of interest (Yermack, 2017). Because encrypted transactions are validated by several parties (Han et al., 2023), companies can share real-time financial statements with partners, auditors and authorities, who can rely on verifiable evidence (Dai & Vasarhelyi, 2017; Giang & Tam, 2023).
Firm performance has financial and non-financial dimensions, and both matter for decision-making and growth. Non-financial performance covers customer satisfaction, staff retention, product quality, market share, productivity, innovation and social and environmental accountability (Monteiro et al., 2022; Soudani, 2012; Tran Thanh Thuy, 2025).
Managers and investors need non-financial information to guide investment decisions (Gulin et al., 2018; Tran Thanh Thuy, 2025), and its quality positively influences the decision management system (Monteiro, 2022). The integrity of accounting information, especially insight into expected cash flows and accruals, helps investors decide well. Najafi et al. (2022) found a significant positive relationship between blockchain and information quality, which ultimately supports financial and market performance (Hung et al., 2023; Tran Thanh Thuy, 2025).
This collection of arguments illustrates the extent to which blockchain has become part of a firm's accounting information. The RBV logic of complementary resources is that the more robust BAAI is, the more reliable the data received via BTA is, it is also timely and auditable, meaning that managers can use the data more effectively to control costs, maintain customers and make market decisions. BTA should therefore translate more strongly into FIP and MAP when BAAI is high. Accordingly, we hypothesize:
H3. BAAI positively moderates the relationship between BTA and FIP.
H4. BAAI positively moderates the relationship between BTA and MAP.
Research gap and contribution
Earlier work leaves three gaps. First, the evidence comes from narrow settings: supply-chain SMEs (Bag et al., 2023), large enterprises (Tseng et al., 2023) and banks in a developed economy (Almadadha, 2025), so cross-sector evidence from an early-stage emerging economy such as Bangladesh is scarce. Second, the accounting literature explains how blockchain can make accounting information more reliable, timely and transparent (Cai, 2021; Dai & Vasarhelyi, 2017; Giang & Tam, 2023) but is largely conceptual, and to our knowledge no study tests whether applying blockchain to accounting information changes the returns from adoption. Third, studies of contingencies examine other moderators and mediators, such as organizational culture (Long et al., 2023) and mechanisms more generally (Abu Afifa et al., 2025), so the RBV claim that value arises through complementary resources is untested for accounting information. Our design answers these gaps with a cross-sector Bangladeshi sample, a BAAI construct and a direct test of the interaction.
The study therefore contributes cross-sector evidence on BTA and firm performance in Bangladesh, separate estimates for FIP and MAP, and a direct test of BAAI as a boundary condition of the BTA–performance link, examining the RBV logic of complementary resources. H1 and H2 follow from the RBV argument that a valuable, rare technological resource improves performance; H3 and H4 from the argument that its value depends on how fully its information is used in the accounting system (Section 2.2).
Research methodology
Research design
We used a quantitative, cross-sectional questionnaire survey of employees of blockchain-adopting firms in Bangladesh, with established scales from prior studies and closed-ended items: demographic items on nominal or ordinal scales and construct items on a 7-point Likert scale (Section 3.3).
Population and sample size
The target population was firms in Bangladesh that have adopted blockchain fully or to some extent, and respondents were employees who knew their firm's blockchain activities, such as accountants, managers, IT officers and senior managers (Table 1). No complete list of adopting firms exists, so a probability sampling frame could not be built. We reached respondents in person at organizations known to use blockchain and online through employees of such organizations, a non-probability convenience sample that is purposive in that only people with knowledge of blockchain use were approached. We chose it because adoption is still limited and no list is available. Of 210 questionnaires distributed, 121 were usable (57.6%), so results should be generalized with caution (Section 6). The data are primary, the unit of analysis is the individual respondent, and the constructs capture respondents' perceptions of their firm; firm characteristics are in Table 1.
Sample size adequacy was checked with SmartPLS 4 power analysis and a standard F-test power calculation. By the inverse square root method (Kock & Hadaya, 2018), 121 observations detect path coefficients of |β| ≥ 0.226 at 80% power and the 5% level. With at most three predictors per endogenous construct (BTA, BAAI and BAAI × BTA), a medium effect (f² = 0.15; Cohen, 1988) needs 77 observations for 80% power at α = 0.05, and the ten-times rule needs 30 (Hair et al., 2022). The sample therefore suffices for the direct effects, but smaller effects such as the interactions are detected with lower power (Sections 4.6 and 6).
Table 1. Demographic profile of respondents (N = 121)
Category | Frequency (n) | Percent (%) | |||
|---|---|---|---|---|---|
Male | 82 | 67.8 | |||
Gender | Female | 36 | 29.8 | ||
Prefer not to say | 3 | 2.5 | |||
Under 25 | 10 | 8.3 | |||
25–34 | 70 | 57.9 | |||
Age group | 35–44 | 18 | 14.9 | ||
45–54 | 16 | 13.2 | |||
55 and above | 7 | 5.8 | |||
Secondary school | 5 | 4.1 | |||
Education level | College diploma | 5 | 4.1 | ||
Bachelor’s degree | 36 | 29.8 | |||
Master’s degree or above | 75 | 62.0 | |||
Senior management | 19 | 15.7 | |||
Department manager | 32 | 26.4 | |||
Current role or position | Accountant | 33 | 27.3 | ||
IT officer | 13 | 10.7 | |||
Other | 24 | 19.8 | |||
Manufacturing | 15 | 12.4 | |||
Trading | 6 | 5.0 | |||
Service | 30 | 24.8 | |||
Nature of business | Agro-based/Food processing | 6 | 5.0 | ||
Mixed (manufacturing + service/trading) | 7 | 5.8 | |||
Bank | 53 | 43.8 | |||
Other | 4 | 3.3 | |||
1–10 | 11 | 9.1 | |||
11–50 | 36 | 29.8 | |||
Number of employees | 51–100 | 20 | 16.5 | ||
101–250 | 20 | 16.5 | |||
More than 250 | 34 | 28.1 | |||
Below 10 years | 33 | 27.3 | |||
11–20 years | 35 | 28.9 | |||
Age of organization | 21–30 years | 24 | 19.8 | ||
31–40 years | 17 | 14.0 | |||
Above 40 years | 12 | 9.9 | |||
Less than 1 year | 33 | 27.3 | |||
1–2 years | 32 | 26.4 | |||
Experience with blockchain | 2–3 years | 30 | 24.8 | ||
3–4 years | 13 | 10.7 | |||
4–5 years | 6 | 5.0 | |||
Above 5 years | 7 | 5.8 | |||
Source: Authors’ compilation | |||||
Table 1 shows the profile of the respondents. Most were male (67.8%) and aged 25 to 34 (57.9%), and 62.0% held a master's degree or higher. Roles were mixed, with accountants (27.3%) and department managers (26.4%) most common. Blockchain use was most common in banking (43.8%), followed by services (24.8%), and firm sizes varied. In addition, 53.7% of respondents had used the technology for less than two years, so blockchain use is still at an early stage in these firms.
Measurement
We used scales from earlier studies: 13 BTA items, 3 FIP items and 3 MAP items from Bag et al. (2023), and 3 BAAI items from Giang and Tam (2023) that capture perceptions of how blockchain affects accounting staffing, the reliability of accounting information and information security (Appendix A). All items used a 7-point Likert scale from 1 (strongly disagree) to 7 (strongly agree), and the constructs are defined in Section 1. After purification (Section 4.3), six of the 13 BTA items remained (Table A1, Table A2, Table A3, and Table A4).
Because all items come from published scales, a single academic reviewed the questionnaire and we revised it on the feedback; no larger expert panel was used, so formal content-validity indices are not available (Section 6). We then pilot-tested it through Google Forms with 35 potential respondents, and the reliability of all constructs was satisfactory. The pilot responses are not part of the 121 used in the analysis.
The final survey ran online and offline from June 2025. By mid-July we had 25 online and 18 offline responses (43 in total); after phone and online reminders a further 78 usable responses arrived, and the survey closed at the end of August 2025 with 121 usable responses.
Data analysis techniques
We used IBM SPSS Statistics (version 26) for descriptive statistics and correlations and SmartPLS 4 (Ringle et al., 2024) for PLS-SEM. The analysis covered: (1) descriptive statistics and Pearson correlations; (2) common method bias (CMB), through Harman's single-factor test and a full-collinearity assessment (Kock, 2015; Podsakoff et al., 2003); (3) the reflective measurement model, through loadings, Cronbach's alpha, composite reliability (ρA and ρc), average variance extracted (AVE), the Heterotrait–Monotrait (HTMT) ratio and the Fornell–Larcker criterion (Fornell & Larcker, 1981; Henseler et al., 2015; Hair et al., 2022); (4) the structural model, through VIFs, path coefficients, R² and f², with bootstrapping (5,000 resamples, two-tailed, α = 0.05, percentile confidence intervals); (5) the moderating effect of BAAI, estimated with the two-stage approach and interpreted through simple slopes (Henseler & Chin, 2010); and (6) model fit (SRMR, dULS, dG and NFI; Henseler et al., 2016). PLSpredict could not be performed (Sections 4.6 and 6). No control variables were included, deliberately: with 121 cases each extra predictor lowers the power to detect the interaction effects, and firm characteristics are described in Table 1 instead. The resulting risk of omitted-variable bias is acknowledged in Section 6.
Results
We estimated the model with PLS-SEM in SmartPLS 4 (Ringle et al., 2024), because the study explains variance in two endogenous constructs, the model includes an interaction term, the sample is small and the data are not normal: Cramér–von Mises tests were significant at p < 0.001 for all four constructs, with negative skewness and positive excess kurtosis (Table 2) (Hair et al., 2019, 2022; Dash & Paul, 2021). The interaction used the two-stage approach (Henseler & Chin, 2010) and the path-weighting scheme, with 5,000 bootstrap samples (two-tailed, α = 0.05, percentile confidence intervals). Results follow the sequence recommended by Hair et al. (2019); the out-of-sample predictive assessment is treated as a limitation (Section 6).
Descriptive statistics and correlation analysis
Table 2 reports descriptive statistics. All constructs are rated above the scale midpoint (means 5.31 to 5.79), with BTA highest (M = 5.79, SD = 0.88) and BAAI lowest (M = 5.31, SD = 1.14). The distributions are negatively skewed (−1.13 to −1.66) with positive excess kurtosis (1.65 to 4.80), which supports the use of PLS-SEM. As Table 3 shows, all constructs are positively and significantly correlated (all p < 0.001): BTA with FIP (r = 0.689), MAP (r = 0.583) and BAAI (r = 0.574); FIP with MAP (r = 0.699); and BAAI with FIP (r = 0.449) and MAP (r = 0.426). These bivariate associations offer only preliminary support for the hypotheses; the structural model below controls for the other constructs, as shown in Table 3.
Table 2. Descriptive statistics of the construct scores
Construct | Items | N | Min. | Max. | Mean | SD | Skewness (SE) | Kurtosis (SE) |
|---|---|---|---|---|---|---|---|---|
BTA | 6 | 121 | 2.83 | 7.00 | 5.793 | 0.881 | −1.308 (0.220) | 1.653 (0.437) |
FIP | 3 | 121 | 1.00 | 7.00 | 5.609 | 0.967 | −1.663 (0.220) | 4.799 (0.437) |
MAP | 3 | 121 | 1.33 | 7.00 | 5.427 | 1.020 | −1.129 (0.220) | 1.866 (0.437) |
BAAI | 3 | 121 | 1.00 | 7.00 | 5.309 | 1.135 | −1.285 (0.220) | 2.050 (0.437) |
Note. Construct scores are the arithmetic means of the retained items on a 7-point Likert scale. BTA = Blockchain Technology Adoption; FIP = Financial Performance; MAP = Market Performance; BAAI = Blockchain Application in Accounting Information. Source: Authors' calculations from survey data. | ||||||||
Table 3. Pearson correlations among the constructs
Construct | 1 | 2 | 3 | 4 |
|---|---|---|---|---|
1. BTA | 1 | |||
2. FIP | 0.689 | 1 | ||
3. MAP | 0.583 | 0.699 | 1 | |
4. BAAI | 0.574 | 0.449 | 0.426 | 1 |
Note. N = 121. All correlations are significant at p < 0.001 (two-tailed). Source: Authors' calculations from survey data. | ||||
Common method bias
Because all constructs came from one self-reported questionnaire, we assessed CMB with two tests (Podsakoff et al., 2003; Kock, 2015). In Harman's single-factor test on the 15 retained indicators, three unrotated components had eigenvalues above 1 and the first explained 47.9% of the variance, below the 50% threshold. In the full-collinearity assessment, all VIFs lie between 1.52 and 2.59 (Table 4), well below 3.3, so CMB is unlikely to be a serious threat. Because 47.9% is close to the cut-off, some residual method variance cannot be ruled out (Section 6).
Table 4. Common method bias assessment
Test | Result | Criterion |
|---|---|---|
Harman's single-factor test: variance explained by the first component | 47.9% | < 50% |
Full-collinearity VIF: BTA | 2.368 | < 3.3 |
Full-collinearity VIF: FIP | 2.592 | < 3.3 |
Full-collinearity VIF: MAP | 2.047 | < 3.3 |
Full-collinearity VIF: BAAI | 1.523 | < 3.3 |
Note. Harman's test is based on the 15 retained indicators. Full-collinearity VIFs are computed from the construct-score correlation matrix produced by SmartPLS (Kock, 2015). Source: Authors' calculations. | ||
Measurement model assessment
Indicator purification, reliability and convergent validity
In the initial estimation, eight of the 13 BTA indicators had outer loadings below 0.70 and the AVE of BTA was only 0.510. Following the standard purification procedure for reflective measures (Hair et al., 2019, 2022), we removed seven indicators (original items BTA1, BTA3, BTA4, BTA5, BTA6, BTA8 and BTA12; Appendix A) and re-estimated the model. The six retained indicators are relabeled BTA1 to BTA6 (Appendix A); one of them (original BTA2) had an initial loading of 0.690 that rose to 0.707 and was kept. The AVE of BTA rose to 0.613 with composite reliability still high (0.904), and the FIP, MAP and BAAI scales needed no change. The deleted items focused largely on cost reduction, responsiveness, stakeholder relationships and trust, and the purified construct is oriented towards access and quality of information, transaction accuracy, productivity and competitive advantage, and has a narrower content domain, which is noted as a limitation (Section 6).
Table 5. Indicator loadings and indicator-level collinearity
Construct | Indicator | Loading | t-value | p-value | VIF |
|---|---|---|---|---|---|
BTA | BTA1 | 0.864 | 24.87 | < 0.001 | 2.840 |
BTA2 | 0.802 | 18.10 | < 0.001 | 2.179 | |
BTA3 | 0.793 | 12.45 | < 0.001 | 2.143 | |
BTA4 | 0.707 | 7.14 | < 0.001 | 1.908 | |
BTA5 | 0.746 | 12.97 | < 0.001 | 1.628 | |
BTA6 | 0.777 | 14.27 | < 0.001 | 1.943 | |
FIP | FIP1 | 0.814 | 15.54 | < 0.001 | 1.527 |
FIP2 | 0.871 | 24.05 | < 0.001 | 2.347 | |
FIP3 | 0.898 | 33.14 | < 0.001 | 2.404 | |
MAP | MAP1 | 0.878 | 22.78 | < 0.001 | 2.348 |
MAP2 | 0.905 | 24.55 | < 0.001 | 2.697 | |
MAP3 | 0.840 | 20.49 | < 0.001 | 1.711 | |
BAAI | BAAI1 | 0.751 | 13.24 | < 0.001 | 1.314 |
BAAI2 | 0.879 | 20.14 | < 0.001 | 2.174 | |
BAAI3 | 0.841 | 17.03 | < 0.001 | 1.933 | |
Note. Loadings, t-values and p-values are from the bootstrap with 5,000 resamples. BTA indicators are shown with their final labels; the correspondence with the original item numbers is given in Appendix A. Source: SmartPLS 4 output. | |||||
As Table 5 shows, all retained loadings exceed 0.70 (0.707 to 0.905; p < 0.001). In Table 6, Cronbach's alpha (0.764 to 0.873), ρA (0.764 to 0.877) and composite reliability ρc (0.865 to 0.907) exceed 0.70 and stay below 0.95 (Hair et al., 2022), and every AVE exceeds 0.50 (0.613 to 0.765), supporting convergent validity (Fornell & Larcker, 1981).
Table 6. Construct reliability and convergent validity
Construct | Cronbach's α | ρA | Composite reliability (ρc) | AVE |
|---|---|---|---|---|
BTA | 0.873 | 0.877 | 0.904 | 0.613 |
FIP | 0.826 | 0.833 | 0.896 | 0.742 |
MAP | 0.846 | 0.845 | 0.907 | 0.765 |
BAAI | 0.764 | 0.764 | 0.865 | 0.682 |
Note. Thresholds: α, ρA and ρc ≥ 0.70 (and < 0.95); AVE ≥ 0.50. Source: SmartPLS 4 output. | ||||
Discriminant validity
HTMT ratios (Table 7) range from 0.530 to 0.836, below the conservative 0.85 threshold (Henseler et al., 2015); the highest, FIP with MAP, is 0.836. Under the Fornell–Larcker criterion (Table 8), the square root of each construct's AVE (0.783 BTA, 0.862 FIP, 0.875 MAP, 0.826 BAAI) exceeds its correlations with other constructs (highest 0.698). Discriminant validity is supported.
Table 7. Heterotrait–monotrait ratio (HTMT)
Construct | BAAI | BTA | FIP |
|---|---|---|---|
BTA | 0.705 | ||
FIP | 0.567 | 0.813 | |
MAP | 0.530 | 0.676 | 0.836 |
Note. Threshold: HTMT < 0.85. Source: SmartPLS 4 output. | |||
Table 8. Fornell–Larcker criterion
Construct | BAAI | BTA | FIP | MAP |
|---|---|---|---|---|
BAAI | 0.826 | |||
BTA | 0.575 | 0.783 | ||
FIP | 0.453 | 0.697 | 0.862 | |
MAP | 0.428 | 0.584 | 0.698 | 0.875 |
Note. Diagonal values (bold) are the square roots of the AVE; off-diagonal values are latent-variable correlations. Source: SmartPLS 4 output. | ||||
Structural model assessment
Collinearity is not a concern: inner VIFs range from 1.32 to 1.66 (Table 9) and outer VIFs from 1.31 to 2.84 (Table 5), all below 3 (Hair et al., 2022). Table 9 and Figure 2 report the bootstrapped results. BTA has a positive and significant effect on FIP (β = 0.564, t = 5.43, p < 0.001, 95% CI [0.355, 0.763]) and on MAP (β = 0.431, t = 4.75, p < 0.001, 95% CI [0.250, 0.604]). Both intervals exclude zero, so H1 and H2 are supported. BAAI has no significant direct effect on FIP (β = 0.033, p = 0.718) or MAP (β = 0.098, p = 0.232); both intervals include zero. The interaction paths are examined in Section 4.5. Figure ? shows the structural model (standardized path coefficients and R² values).
Table 9. Structural model results: path coefficients, effect sizes and collinearity
Hypo-thesis | Path | β | SD | t | p | 95% percentile CI | f² | VIF |
|---|---|---|---|---|---|---|---|---|
H1 | BTA → FIP | 0.564 | 0.104 | 5.43 | < 0.001 | [0.355, 0.763] | 0.412 | 1.663 |
H2 | BTA → MAP | 0.431 | 0.091 | 4.75 | < 0.001 | [0.250, 0.604] | 0.182 | 1.663 |
– | BAAI → FIP | 0.033 | 0.092 | 0.36 | 0.718 | [−0.135, 0.222] | 0.002 | 1.539 |
– | BAAI → MAP | 0.098 | 0.082 | 1.20 | 0.232 | [−0.059, 0.265] | 0.010 | 1.539 |
H3 | BAAI × BTA → FIP | −0.167 | 0.076 | 2.19 | 0.029 | [−0.252, 0.047] | 0.098 | 1.316 |
H4 | BAAI × BTA → MAP | −0.142 | 0.068 | 2.09 | 0.037 | [−0.233, 0.043] | 0.054 | 1.316 |
Note. β = standardized path coefficient; SD = bootstrap standard deviation; CI = confidence interval (percentile method, 5,000 resamples, two-tailed). The bias-corrected 95% intervals for the interaction paths are [−0.276, −0.008] (FIP) and [−0.258, −0.005] (MAP). Source: SmartPLS 4 output. | ||||||||
The model explains 53.6% of the variance in FIP (R² = 0.536; adjusted R² = 0.524) and 38.7% in MAP (R² = 0.387; adjusted R² = 0.372) (Table 10), which is moderate for FIP and weak to moderate for MAP (Hair et al., 2019). Using Cohen's (1988) benchmarks, BTA has a large effect on FIP (f² = 0.412) and a medium effect on MAP (f² = 0.182). The direct effects of BAAI are negligible (f² = 0.002 and 0.010) and the interactions are small (f² = 0.098 and 0.054).
Table 10. Coefficient of determination
Endogenous construct | R² | Adjusted R² | Interpretation |
|---|---|---|---|
FIP | 0.536 | 0.524 | Moderate |
MAP | 0.387 | 0.372 | Weak to moderate |
Note. Benchmarks: 0.25 weak, 0.50 moderate, 0.75 substantial (Hair et al., 2019). Source: SmartPLS 4 output. | |||
Moderation analysis and simple slope analysis
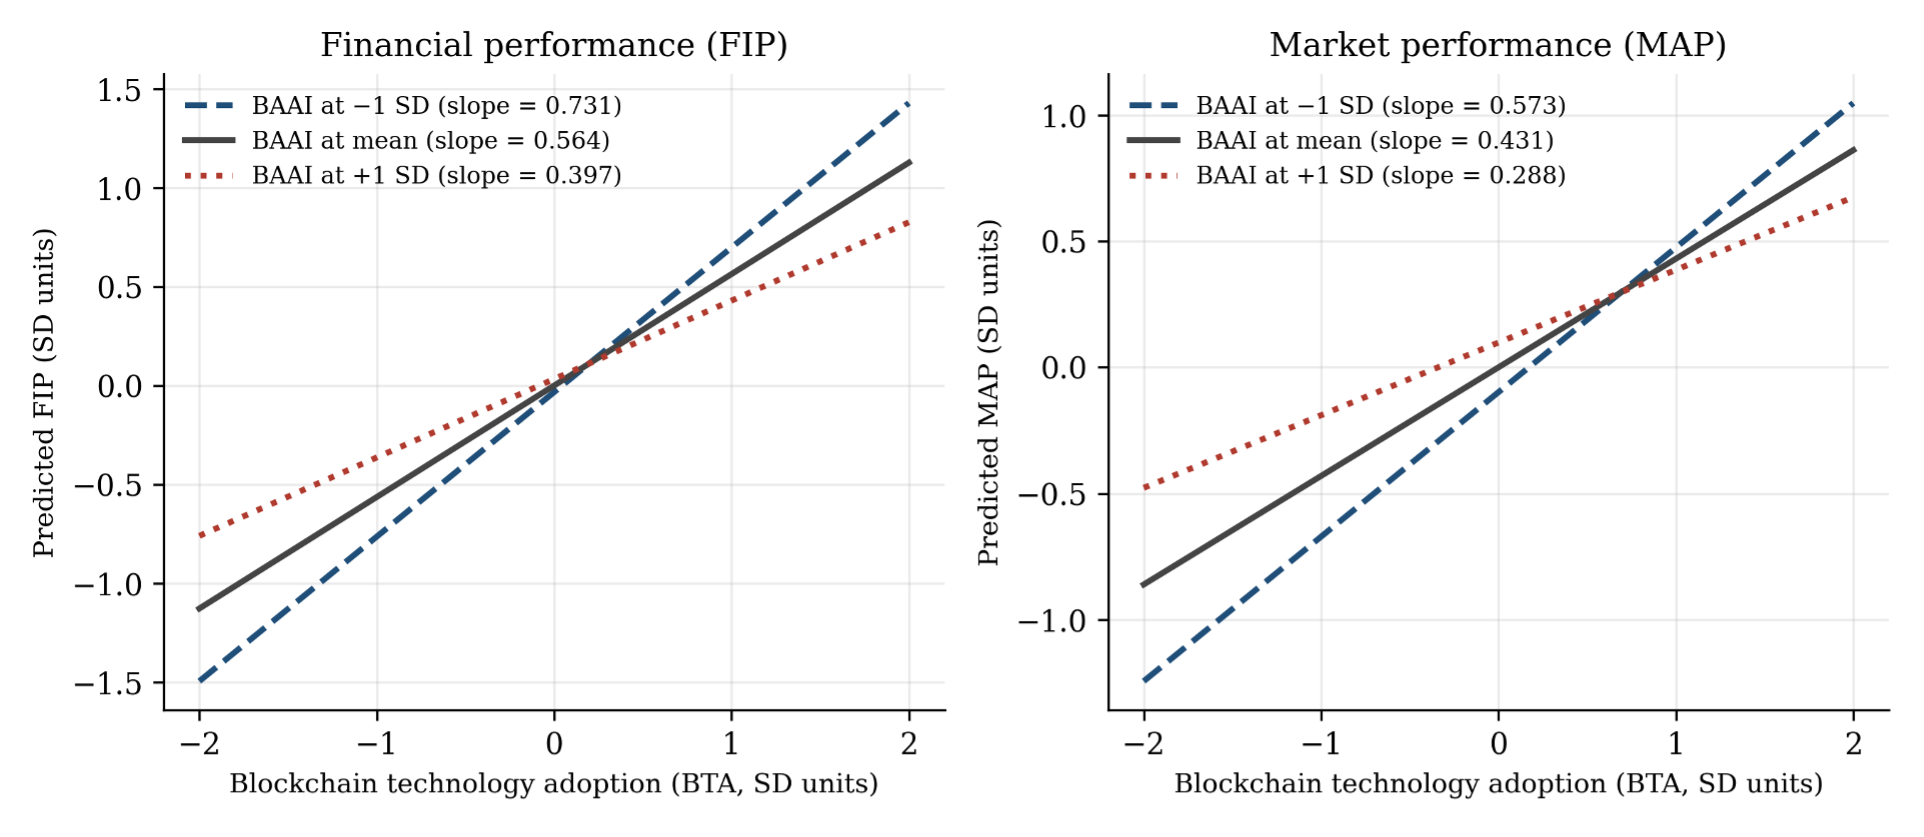
The BAAI × BTA interaction is negative for both FIP (β = −0.167, t = 2.19, p = 0.029) and MAP (β = −0.142, t = 2.09, p = 0.037), but the evidence is weaker than these p-values suggest. The 95% percentile intervals, [−0.252, 0.047] and [−0.233, 0.043], include zero; the bias-corrected intervals ([−0.276, −0.008] and [−0.258, −0.005]) exclude it only marginally; and the bootstrap distributions are shifted toward zero. The effects are also small, adding about 4.6 and 3.3 percentage points to the R² of FIP and MAP. We therefore treat them as small, negative, statistically fragile and indicative rather than conclusive. Because H3 and H4 predict a positive moderating effect and the estimated sign is negative, neither is supported: BAAI weakens, rather than strengthens, the relationship between BTA and each outcome.
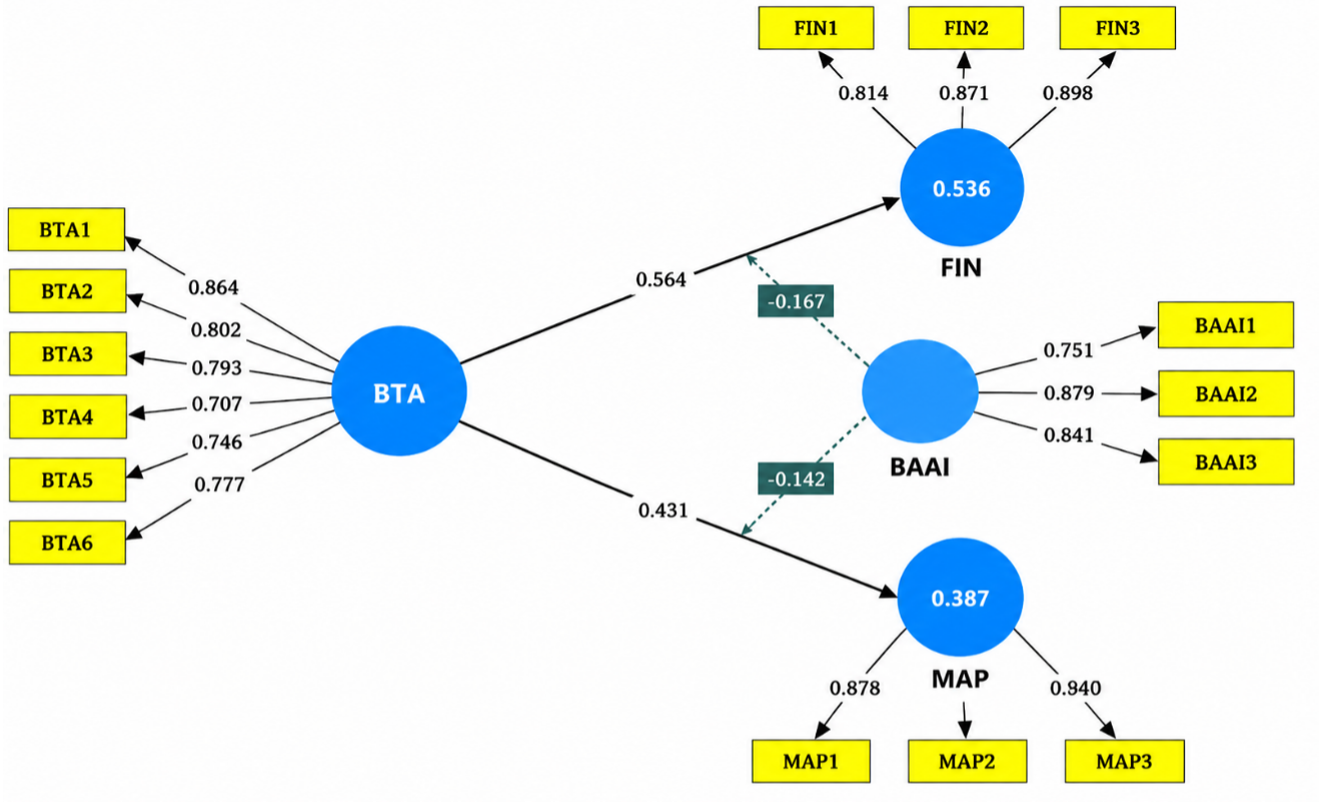
Table 11 and Figure 2 give the simple slopes. For FIP, the slope of BTA is 0.564 at the mean of BAAI, 0.731 at one standard deviation below and 0.397 above (difference 0.334). For MAP, the slopes are 0.431, 0.573 and 0.288 (difference 0.285). All conditional slopes stay positive, so high BAAI attenuates but does not reverse the BTA–performance association. Significance tests of the conditional slopes were not in the SmartPLS output, so the slopes are interpreted descriptively.
Table 11. Simple slope analysis: conditional effects of BTA
Level of BAAI | BTA → FIP | BTA → MAP |
|---|---|---|
−1 SD (low) | 0.731 | 0.573 |
Mean | 0.564 | 0.431 |
+1 SD (high) | 0.397 | 0.288 |
Difference (low − high) | 0.334 | 0.285 |
Note. Values are standardized conditional effects of BTA (simple slopes) at the mean of the moderator and at one standard deviation below and above it, as reported by SmartPLS. Source: SmartPLS 4 output. | ||
Model fit and statistical power
SRMR is 0.094 for the estimated model and 0.071 for the saturated model (Table 12), against the conventional cut-off of 0.08 (Hu & Bentler, 1999; Henseler et al., 2016), although values below 0.10 are sometimes tolerated in PLS-SEM. The saturated value shows that the measurement structure reproduces the indicator correlations well; the estimated value is slightly higher, probably in part because the model has no path between FIP and MAP although they correlate strongly (r = 0.699). NFI (0.794) is below the customary 0.90. The bootstrap-based tests for SRMR, dULS and dG were not in the output used, so fit is interpreted with caution, and because PLS-SEM is prediction-oriented these indices carry less weight than explanatory power (Hair et al., 2019).
Table 12. Model fit indices
Fit index | Saturated model | Estimated model |
|---|---|---|
SRMR | 0.071 | 0.094 |
dULS | 0.612 | 1.068 |
dG | 0.317 | 0.351 |
Chi-square | 218.5 | 221.7 |
NFI | 0.797 | 0.794 |
Note. Reference values: SRMR < 0.08 (good fit); NFI close to 1 indicates better fit. Source: SmartPLS 4 output. | ||
R² and f² show explanatory power (Section 4.4). The out-of-sample assessment recommended for PLS-SEM, PLSpredict with Q²predict and a comparison of RMSE or MAE against a linear-model benchmark (Shmueli et al., 2019), could not be carried out. The R² and f² values therefore describe in-sample explanatory power only, and predictive relevance is not established (Section 6). Achieved power at α = 0.05 is 1.00 for BTA → FIP and 0.999 for BTA → MAP, but only 0.577 and 0.469 for the BAAI × BTA paths to FIP and MAP; detecting effects of that size with 80% power would need about 222 and 305 observations. The direct effects are thus estimated with ample power, while the moderation results carry a higher risk of Type II error and need replication in larger samples.
Discussion
Discussion of the findings
BTA is positively and substantially associated with both financial and market performance, so H1 and H2 are supported. This fits the RBV argument that a valuable, rare, hard-to-imitate technological resource contributes to performance and agrees with earlier evidence from supply-chain SMEs (Bag et al., 2023), bank ROA and ROE (Almadadha, 2025; Li, 2025), large enterprises (Tseng et al., 2023) and market value (Ali et al., 2023). Measurement differs, however: Almadadha (2025) used archival data from Australian banks, whereas we use respondents' perceptions in a cross-sector sample where banks make up 43.8% of firms. A positive association in both archival and perceptual data strengthens confidence in its direction, but perceptual measures can inflate its size and a cross-sectional design cannot support causal claims.
The effect of BTA is larger for FIP (f² = 0.412) than for MAP (f² = 0.182), and the model explains more variance in FIP (R² = 0.536) than MAP (R² = 0.387). One plausible reading is that the retained BTA indicators stress data access, transaction accuracy and productivity, which sit close to the efficiency and cost mechanisms behind the FIP items, whereas the MAP items (new markets, new products and their success) depend more on market-facing capabilities and outside conditions that adoption alone is unlikely to supply. This fits the RBV emphasis on complementary resources, but we did not test it.
BAAI has no significant direct effect on either outcome: once the extent of adoption is accounted for, using blockchain for accounting information is not independently associated with performance. This differs from largely conceptual claims that blockchain-based accounting information improves firm outcomes (Cai, 2021; Giang & Tam, 2023), and fits the view that better accounting information helps only when it is turned into decisions (Monteiro et al., 2022; Tran Thanh Thuy, 2025), a step we did not measure.
The moderation results do not support the hypothesized amplifying role of BAAI: the interaction is negative for both outcomes, and the BTA–performance relationship is weaker at high than at low BAAI, though still positive. Because the interactions are small and fragile (Section 4.5), the following are possible readings, not established mechanisms. First, BTA and BAAI may draw on the same information-quality channel, so their joint contribution is less than additive, which qualifies the assumption that resources are always complementary. Second, deep use of blockchain in accounting may bring legacy-system integration, training and adjustment burdens linked to technology overload, the rival argument set out in Section 2.2 (Karr-Wisniewski & Lu, 2010; Karajovic et al., 2019; Akter et al., 2024); we did not measure them, and our design cannot show whether they are transitional. Third, two of the three BAAI items refer to staff reductions and to shifts that may affect the reliability of accounting information, so high scores may partly reflect perceived disruption, and BAAI is the least reliable scale in the model (α = 0.764). Fourth, responses cluster at the top of the scale, limiting variation at high BAAI and BTA.
There are limited studies on accounting-information moderators of the relationship between the blockchain and performance (Section 1), which results in limited direct benchmarks. The concept of moderator (organizational culture) is also discussed in related work (Long et al., 2023), and the concept of moderating and mediating is discussed in general (Abu Afifa et al., 2025). Our negative BAAI interaction shows that a contingency can also dampen the effect of adoption, but we cannot determine whether this is because of the moderator, the context or the measurement. It is an exploratory finding which requires replication in a larger sample with a validated BAAI measure.
Theoretical implications
First, the findings align with the RBV proposition that the blockchain can be a strategic asset: adoption is positively correlated with financial and market performance of those firms that are adopting, and in an emergent economy with limited evidence. Second, they clarify the nature of the treatment of complementarity in the RBV: adopting blockchain and using blockchain-based accounting information does not necessarily create returns, and in certain cases, the combination of resources can be sub-additive, emphasizing the need to test the value of the combinations of resources rather than assuming it is. Third, modeling FIP and MAP separately indicated that the resource–performance relationship varies by outcome type, but this difference between the two paths was not explicitly tested.
Methodological implications
First, conclusions regarding moderation may vary as a function of the inferential criterion (t-based p-values, percentile intervals, and bias-corrected intervals provided different signals for the interactions, suggesting the importance of reporting confidence intervals, effect sizes, simple slopes, and power in addition to p-values for interpreting moderation). Second, the reduction of the BTA scale items from 13 to six items reveals that scales developed in supply-chain contexts (Bag et al., 2023) might require recalibration in samples that span contexts. Third, the BAAI items are worded in a mixed manner and require validated scales which distinguish quality effects from perceived disruption. Fourth, the CMB collinearity and fit checks reported here provide a model for transparent reporting of PLS-SEM.
Managerial and practical implications
The association between BTA and both outcomes is strong, so investing in blockchain may be worth considering for managers, but the evidence is correlational and perceptual and does not show that adoption causes better performance. Financial advantages appear to be more closely related to adoption than market advantages, meaning that firms interested in new markets and/or new products might need more complementary market-oriented capabilities that were not tested. It is reasonable to expect that a phased approach with pilots, training and evaluation at each step, should be used when going deeper into BAAI in accounting but if the relationship weakens at high BAAI, it is not assumed to lead to more returns, which is outside the scope of our data. Clearly established accounting standards, accounting principles and training from the regulatory bodies would also benefit, especially in the context of barriers reported in Bangladesh (Mahmud & Uddin, 2023).
Societal implications
The literature suggests that transparent and auditable records can enhance trust in financial reporting and minimise fraud (Cai, 2021; Han et al., 2023). Fraud and trust and/or public-interest outcomes were not measured, so there is an indirect implication of the society. The positive performance results we found for adopters may guide public and professional investment in digital skills, accounting education and enabling regulation, which could widen access for smaller firms, and it cautions policy-makers against technology mandates without implementation capacity.
Limitations and future research directions
Several limitations should be noted. First, because the cross-sectional design observes firms at only one point in time, it does not permit the testing of the causal order, nor does it demonstrate how the relationships are altered with experience; therefore, longitudinal or panel studies are required to test for the possibility that the relationships, including the weaker slope at high BAAI, vary over time.
Second, the sample is small (n = 121) and skewed towards banking (43.8%) and services (24.8%) which means there is limited generalizability. It is sufficient for the direct effects, but has low power for the interactions (0.577 and 0.469). Additionally, it is a non-probability sample, not representing a complete list of adopters, and therefore self-selection can occur, which may lead to results not representative of all adopting firms. Larger and probability based samples should be used for future studies, if a frame exists, and multi-group analyses by sector and firm size should be performed.
Third, the study is based on primary and self-reported data, which comes from a single source only. The CMB tests did not reveal a serious problem but the first factor accounted for 47.9% of the variance, which is near the 50% criterion, and perceptual performance measures may exaggerate relationships. Future research should integrate surveys with archival performance data or multiple sources of performance data.
Fourth, the BTA scale was reduced from 13 to six items, which narrowed its content domain; content validity rests on published scales and the review of a single academic, without a formal expert panel; the three-item BAAI scale has mixed wording and the lowest reliability; and SRMR is higher than the 0.08 benchmark in the estimated model (0.094), which suggests that results should be interpreted together with the fit indices.
Fifth, the model has no control variables, to preserve power for the interactions given the sample size. Firm size, age, industry and blockchain experience may influence both adoption and performance, so omitted-variable bias cannot be excluded and estimates may be over- or understated. Larger samples should include these controls and test the technology–organization–environment (TOE) framework alongside the RBV.
Sixth, we did not assess out-of-sample predictive power. PLSpredict (Shmueli et al., 2019), which reports Q²predict and compares the RMSE or MAE of the PLS-SEM predictions with a linear-model (LM) benchmark, could not be run, so the model's predictive relevance is unknown and R² and f² describe in-sample explanatory power only. The findings should be read as explanatory, not predictive, and future research should apply PLSpredict to a larger sample and report Q²predict with RMSE or MAE against the LM benchmark.
Conclusion
This study examined whether blockchain technology adoption (BTA) is associated with financial performance (FIP) and market performance (MAP) among blockchain-adopting firms in Bangladesh, and whether blockchain application in accounting information (BAAI) moderates these relationships. In 121 survey responses analyzed with PLS-SEM, BTA is strongly related to FIP (β = 0.564) and moderately to MAP (β = 0.431). BAAI has no direct effect on either outcome, and the BAAI × BTA interaction is negative, small and statistically fragile, with BTA remaining positive at every level of BAAI. H1 and H2 are therefore supported, and H3 and H4 are not.
The study contributes to the RBV literature by showing an association between adoption and performance in a cross-sector emerging-economy sample, and by indicating that combining adoption with blockchain-based accounting information does not necessarily add value. Methodologically, it shows the importance of reporting confidence intervals, effect sizes, simple slopes and power for moderation tests, and of re-validating scales in new settings. For managers and policymakers, the results should inform rather than replace investment appraisal, and the weaker slope at high BAAI argues for evaluating, not assuming, the added value of blockchain in accounting.
These conclusions are limited by the cross-sectional design, the modest self-reported sample, the lack of control variables and the lack of an out-of-sample predictive assessment, and they describe associations, not causal effects or changes over time. Future research should use longitudinal designs, objective performance data and controls, replicate the moderation test in larger sector-specific samples, and develop a validated measure of blockchain-enabled accounting information
Author Contributions
Mst. Farhana Hossen Shova: Conceptualization, Writing – original draft, Methodology, Supervision, Writing – review & editing.
Declaration of Competing Interest
The authors declare no conflicts of interest.
Ethics Statement
Not applicable.
Data Availability
Data available on request from the corresponding author.